Climate Change
a pragmatic guide
Last updated: March 20th, 2022 · 16 min read
If you see anything inconsistent, or would like to propose a change, feel free to contact us.
This is a pragmatic guide to what Climate Change is, what the drivers behind it are, and what we as individuals can do about it.
1. The Earth
2. Humans
3. What can we do?
1. The Earth
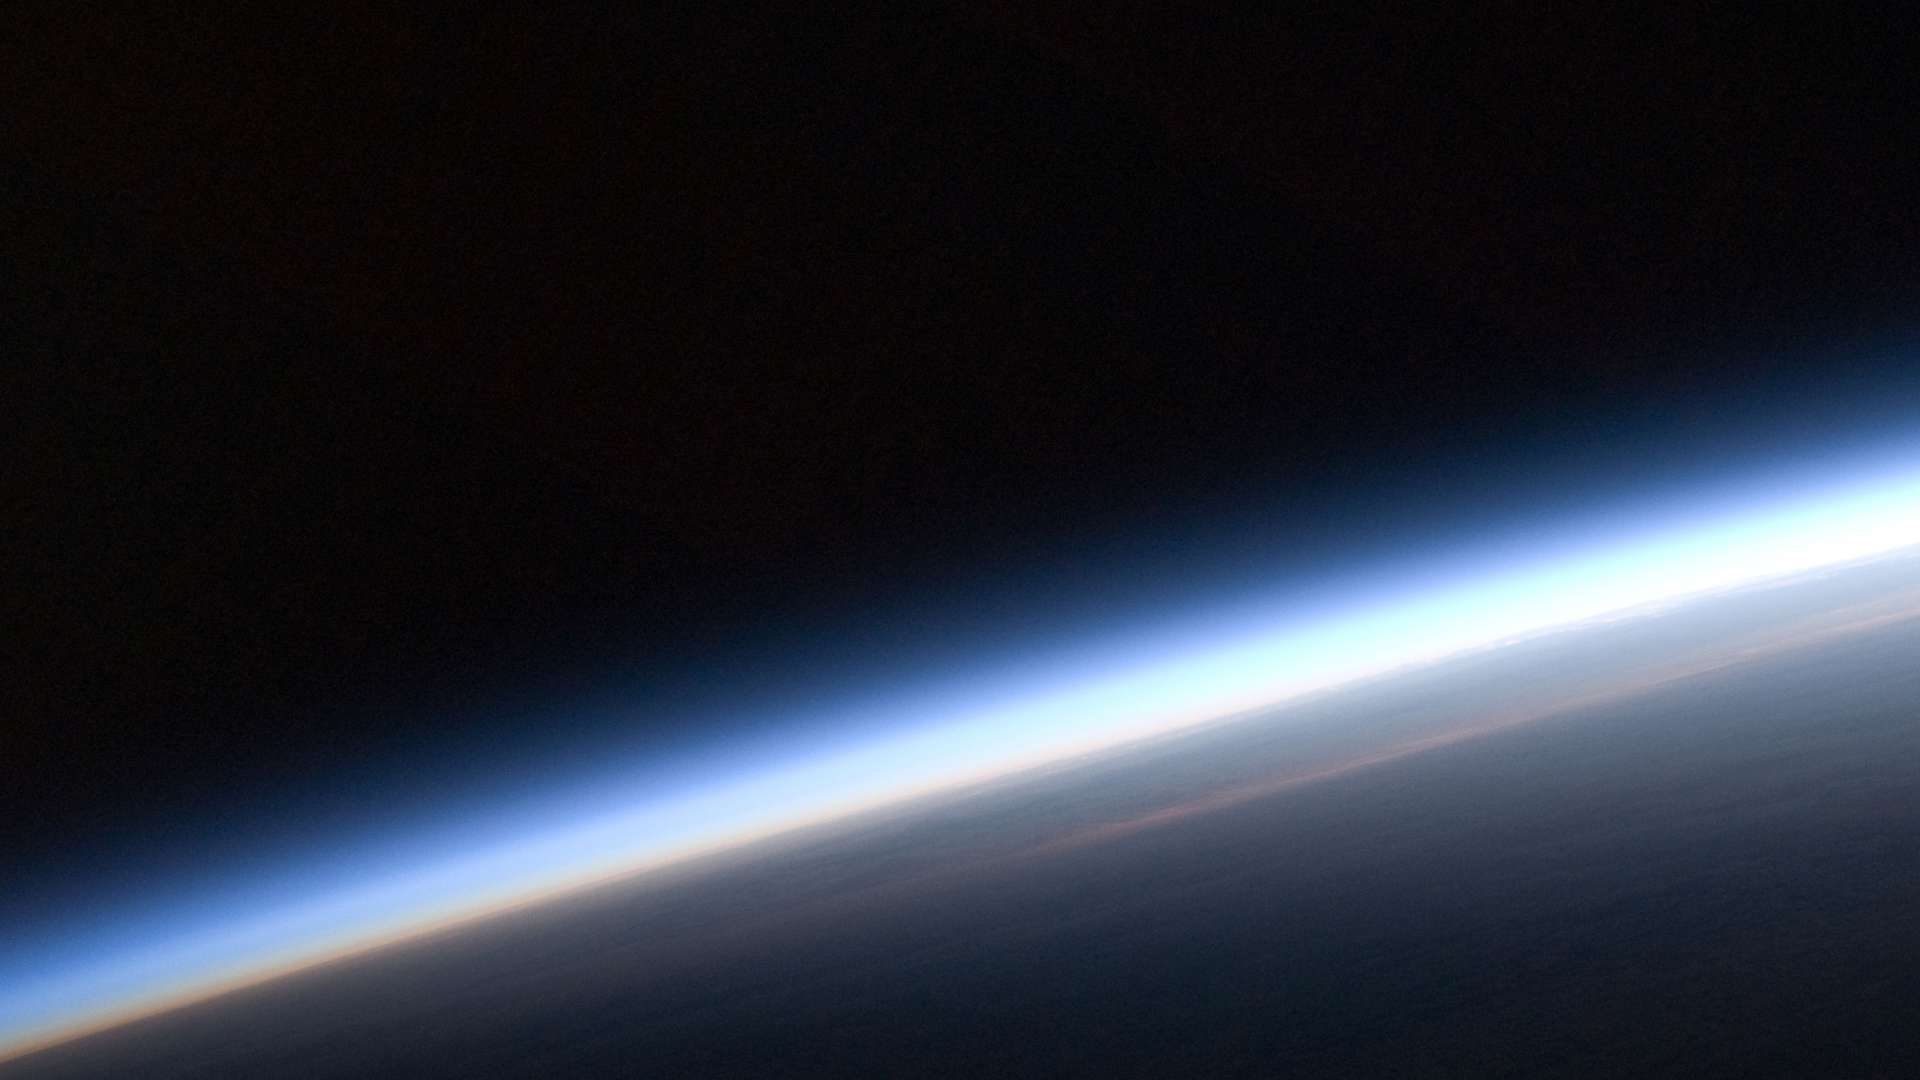
The state of Climate Change
’Warming of the climate system is unequivocal, and since the 1950s, many of the observed changes are unprecedented over decades to millennia’, writes the Intergovernmental Panel on Climate Change (IPCC) in its fifth assessment.
Seventeen of the 18 warmest years have all occurred since 2001 (with the exception of 1998). Furthermore, NOAA reported in August 2016 that each of the previous 16 months were the warmest they’ve ever measured. The measured warming has been found to be consistent across seasons and regions.
We have now achieved a temperature increase of 1°C since the end of the 70s. A change of 1°C in 50 years is unprecedented, as it can be seen from the following reconstruction of temperatures in the last 11 000 years:
What is worrying is not so much the change itself, but rather the speed at which this change is taking place. Historically, a change of 1°C seems to happen in thousands of years - not decades. The Earth is a complex ecosystem, and disturbing it by as little as a couple of degrees in the blink of decades (or even centuries) is a heavy disturbance.
Consequences
A couple of degrees change in the average yearly temperature is far from a minor event. When Earth’s temperature was 5°C lower, the sea level was 120m lower and all of Northern Europe and Canada were covered by a gigantic ice cap (one could hike from Vermont to Greenland). Furthermore, average temperatures do not tell the whole story. As average temperatures increase, the likelihood of extreme temperature events might increase as well.
A change of a couple of degrees over the surface of the Earth first causes the oceans to absorb the extra heat. In the process, they expand (raising the sea level) and cause increased evaporation, which leads to perturbed air and water currents. This yields an increased likelihood of extreme weather events, such as drought, hurricanes or floods. This is already observed as e.g. coral reefs are starting to die.
Longer term effects are harder to quantify as a temperature change this sudden has never been witnessed in the past. To get a rough idea, this map shows what the world will look like 4° warmer while this article shows how sensitive birds and bees are to climate change. Furthermore, higher temperatures and more extreme weather causes crops to fail, which could force 1.2 billion people to migrate by 2050, causing increased inequalities leading to global instability. Finally, the inability of the human body to cool itself in high temperature and humidity situations might cause more than half of the world population to live in inhabitables areas by 2100.
Climate change is indeed the most serious issue of our time.
What causes it?
Some gases are transparent to the sun’s incoming rays heating the Earth, but are opaque (acting as mirrors) with respect to outgoing rays emitted back from the Earth. Those gases act as a blanket, trapping heat that is unable to escape. They are called greenhouse gases due to their warming behaviour. This greenhouse effect stabilises our climate, keeping nights relatively warm despite being deprived of sunlight.
One of those greenhouse gases is carbon dioxide (CO2). By drilling ice cores (columns of ice containing small bubbles of old trapped air), scientists have been able to infer historical CO 2 concentration up to 800 000 years BC. This concentration has been relatively stable up to the industrial revolution, where it skyrocketed. Again, what is worrying is the speed at which the change of concentration is happening. Both the concentration level and the speed of change are unprecedented in the history of measurements (use the handles at the bottom of the graph to zoom in and out):
The same trend is visible with other greenhouse gases such as methane (CH4) and nitrous oxide (N2O).
By comparing the factors causing heating and cooling of the atmosphere between the pre-industrial period (where the greenhouse gas atmospheric levels had not yet increased) and now, we observe that the drastic increase in greenhouse gases is the main driver behind the observed warming (although some other effects do cause a certain amount of cooling):
It is important to state that some greenhouse gases will keep warming the Earth many years after they have been emitted, because they do not disappear instantaneously. Up to 40% of the CO2 emitted today will still be present 1 000 years from now, thus still causing warming (see FAQ 12.3 here). If we were to stop emissions today, CO2 levels would essentially never come back to its pre-industrial level on timescales relevant for our society.
This is in stark contrast with the immediate and ephemeral cooling effect of volcanoes eruptions or man-made aerosols such as sulphates, nitrate or soot that stay in the atmosphere for a very short time. It is therefore very important to reduce greenhouse gas emissions very quickly, as they will affect the climate in the centuries (even millenniums) to come. So how do we do it?
2. Humans
Where do greenhouse gases come from?
Most greenhouse gases come from burning fossil fuels (oil, gas or coal). That happens as soon as we drive a car, take a plane or use electricity. It also indirectly happens when we consume objects or foods that require a lot of energy to be produced or assembled from parts transported from afar.
A substantial amount of agricultural emissions comes from cows and other livestock emitting methane (CH4) as part of their digestive process. Furthermore, deforestation leads to less trees absorbing CO2 through photosynthesis, and the use of nitrogen-based fertilizers in agriculture emits Nitrous Oxide (N2O), which is a greenhouse gas. Note that the use of fossil fuels (or electricity) for operating agricultural machines is not even included in agricultural emissions. By comparison, all road-travel globally only accounts for 12%.
Finally, some 8% of global emissions relates to certain types of heavy industrial processes, such as kiln production for cement works, whose emissions are not related to the burning of fossil-fuels, and which must be accounted for separately.
Fossil fuels are used everywhere, and for good reasons
Historically, the world’s energy has come from burning trees (biomass) for heat and tool manufacturing. However, the invention of an efficient steam engine by James Watt in 1784 meant humans were now able to convert existing fossil fuels (coal, and later oil and gas) into intensive mechanical work (lifting heavy objects or turning the wheels of a very heavy train for example). Furthermore, it enabled humans to build machines to dig up even more fossil fuels, enabling an exponential growth of our energy usage.
The discovery of new types of fuels such as oil and gas did not replace the usage of existing fuels: it fuelled additional growth instead.
Although wind and solar power are a decent part of newly installed energy production facilities nowadays (we hear about it very often in the news), it is still only 1% percent of global primary energy supply. In fact, we see that we currently still get more than 80% of our energy from fossil fuels, which surprisingly is exactly the same as in 1980: the growth of renewables has been matched by (or even outpaced by) a similar growth of fossil fuels. How come?
The answer is that fossil fuels pack an intense amount of energy in a small volume and small weight. Oil in particular, being light and dense, enabled the invention of modern transportation.The energy released when burning 1 litre of oil is equivalent to 25 professional athletes cycling for one hour. That single litre of oil weighs under 1 kg and costs 100 to 1000 times less than the equivalent human labour.Thus it is no mystery that intensive human labour got replaced by machines, propelling humanity into an industrialised age where the use of fossil fuels displaced jobs from agriculture to the service sector.
Every day an average person on Earth uses roughly 60 kWh of energy per day. That means that every day, we each have an equivalent of 15 professional cyclists dedicated to us to support our living standards. The current quality of life that we are enjoying has been enabled by the efficient use of fossil fuels freeing us from intensive human labour.
To get an even more concrete idea, take a look at this video to see Robert Förstemann, professional track cyclist and sprint specialist, struggle to power his toaster:
Nowadays we don’t spend an enormous amount of our time and energy to power our toaster: we use electricity instead which unfortunately is still mostly generated by burning fossil fuels.
3. What can we do?
Objective: 2 tons CO2eq per human per year by 2050
All greenhouse gases differ by how much radiation they trap and by how long they stay in the atmosphere. To be able to compare them, we convert the mass of any greenhouse gases into the mass of CO2 that would yield an equivalent warming over 100 years. That unit is called CO2 equivalent, abbreviated CO2eq. For example, 1g of N2O (nitrous oxide, used in fertilizers) corresponds to 300gCO2eq.
The Paris climate accord has set the world an objective of limiting global warming to 2°C objective at horizon 2100. In order to get there, models projecting global emission compatible with the 2°C objective have been made. Using population growth projections, we can deduce the amount CO2eq we should be allowed to emit per person and per year:
2 tons CO2eq per person per year by 2050
0 tons CO2eq per person per year by 2070
This also means using only 34% of the proven fossil fuel reserves, leaving the rest of it in the ground. It is highly unlikely that the free market, without any regulation, achieves this result.
So how do we all reach that objective? Do we recycle more? Eat organic? Vote for more wind turbines? In this jungle of complex decisions, some pragmatism has to be introduced in the form of a sober quantification of the impact of the different choices we make.
It all starts with figuring out how much we’re emitting compared to the 2t objective. Here’s an estimate of personal emissions depending on where you live:
Most countries in the world are far from the 2t objective. Note that the more a country is populated, the more its average footprint will affect global emissions. For example, the United States has an average footprint almost identical to Canada, but due to its large population it contributes to 14% of global emissions (compared to only 2% for Canada). We therefore need to look at both population and footprint per person:
80% of the world lives above the 2t objective. Furthermore, half of the world is above the 5t objective for 2030. This is no small challenge, and the matter must be taken seriously.
Note that even within a country, our personal footprint can vary quite a lot depending on our wealth and consumption habits. Therefore, it is important to be able to measure our footprint precisely enough to trigger personal behavioural change.
In the next sections we’re going to give an overview of the impact of some daily decisions we make related to transportation, food and electricity. We will present comparable quantities in order to show which behaviour changes can have the most impact.
Finally it is important to understand that no activity is carbon-free. Even the production of renewable energy requires the construction of wind turbines and solar panels, which will emit greenhouse gases during transportation, assembly, and mining of the necessary rare metals.
Transportation: Reduce long-distance travels
Note that even though long-distance plane trips are almost as efficient (per distance travelled) as conventional cars, they end up being a substantial part of our footprint, due to the fact that we use them for longer distances. If you can, travel by train, use shared mobility, or simply reduce distances travelled.
Ultimately, in order to completely get rid of fossil fuels, we will have few choices but to switch to electric transportation with electricity being produced carbon-free (else, it would reduce all of our efforts to nothing).
Electricity: remove coal, gas and oil power plants
It is crucial that we get rid of fossil fuels for electricity generation. To keep track of how we stand, check out the electricityMap App. Low-carbon strategies fall into two categories in regions where the terrain does not allow the installation of large-scale hydropower: nuclear and wind/solar. Nuclear has a waste problem, while wind and solar generation is variable. Variable renewables can either be balanced in time with storage or in space using transmission networks, or a combination of the two.
If you’re living in a country with high renewable penetration, you can reduce the need for storage by consuming electricity when the wind blows, or when the sun shines. Even better: have your heating systems and electric car do it automatically.
Food: avoid red meat
The simplest thing you can do is to avoid red meat, as cows and sheep require a lot of resources and emit a lot of greenhouse gases as part of their digestive process. It has been estimated that a meat-intensive diet usually has twice the footprint of a vegetarian one. Note also that the footprint of transportation and packaging is less than one would think, as the production costs dominate.
It is important to note that although doing differently might help, reducing your absolute level of consumption might be the only way to get to the 2t objective. Even a low-carbon activity can cumulate to great amounts when repeatedly carried out.
Information must be accessible and widely spread
How do we get a whole civilisation to shift consumption patterns?
At Tomorrow we have a vision of a world where the price we pay for goods and services takes into account long-term climate consequences (also called externalities).
This would naturally reward low-carbon consumption decisions, incentivizing people to stay under the 2t yearly budget.
In order to get there, we must put in place a consumer-centric carbon tax. It could very well replace the VAT (Value-Added Tax), such that the total amount of tax is kept equal but simply distributed differently across goods, making low-carbon products cheaper.
This requires centralizing knowledge about the carbon intensities of each and every one of our activities, enabling us to take better decisions.
We believe that organisations and consumers should be made aware and rewarded for positive action. We believe that by giving them an idea of the impact of their consumption, they become empowered to make better decisions.

We're on a mission to build the information technology that will enable sustainable means of consumption. Join us if you'd like to help us make it happen.